
Locus Diagram of AC Circuit
Locus diagrams in electrical engineering show graphically the frequency dependence of admittances and impedances.
Before we start, a brief explanation of the following terms used in this chapter. In electrical engineering:
- The susceptance(B) is the imaginary part of admittance (Y), where the real part is conductance (G). In SI units, admittance is measured in siemens.
- The reciprocal of admittance is impedance (Z), where the imaginary part is reactance (B) and the real part is resistance (R).
Locus diagram of series R-L circuits
At f = 0 Hz, the inductive reactance according to XbL = j ꙍL has the value 0 Ω - thus the imaginary part of the impedance is zero. If the frequency increases, the inductive reactance also increases. → the pointer tip of the impedance moves on a straight line parallel to the imaginary axis.
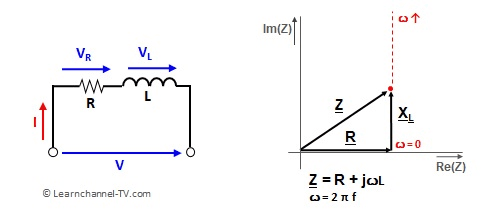
Locus diagram of series R-L circuits - impedance
You already recognize one disadvantage of the Locus Diagram of a RL Series Circuit: For big frequencies, i.e. ꙍ = 2πf, the reactive component becomes very large and thus the straight line of the locus curve also. A solution would be the representation of the admittance, i.e. the reciprocal of the impedance:
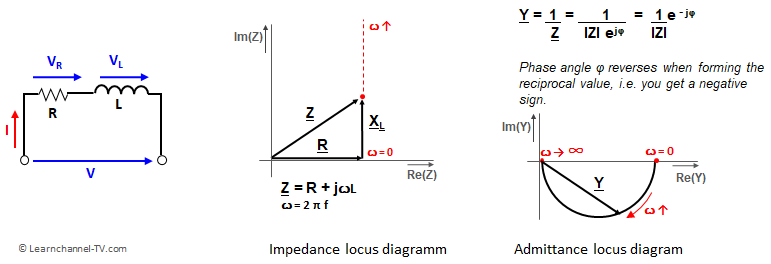
Locus Diagram for Impedance and Admittance of a RL series circuit
For f = 0 Hz, only the ohmic resistance is effective in an RL-series circuit. As the frequency increases, the inductive reactance increases and the magnitude of the admittance Y decreases. The phase thereby moves from 0° to -90° with the pointer tip for Y moving on a semicircle.
Locus diagram of series R-C circuits
The reactance of a capacitance is calculated as XC = 1 / (2πfC). According to this, the capacitive reactance, i.e. impedance at DC voltage, i.e. for f = 0 Hz is infinitely large, comparable to an interruption. If the frequency increases, the capacitance becomes more and more conductive. Because the voltage VC at the capacitor lags behind the current by 90°, the pointer of the locus curve for RC series is in the negative imaginary range.
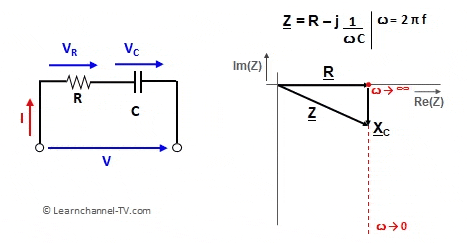
Locus diagram RC in series
The locus diagram of the admittance is again a semicircle in shape, but now in the positive imaginary part. Since the admittance is the reciprocal of the impedance, the sign of the imaginary part must reverse when the reciprocal is formed.

Impedance and Admittance Locus diagram of R-C in series
Locus diagram of series RLC circuits
With an RLC series connection, two effects come together:
- At f = 0 Hz, the inductive reactance XL = 0 Ω, while the capacitive reactance tends to infinity.
- At f → ∞ Hz the inductive reactance also tends towards infinity; the capacitive reactance, on the other hand, approaches zero.
- At resonant frequency, the following condition applies: XC = XL, i.e. both reactances cancel each other out, with the result that only the ohmic resistance appears at the terminals of this series circuit RLC.
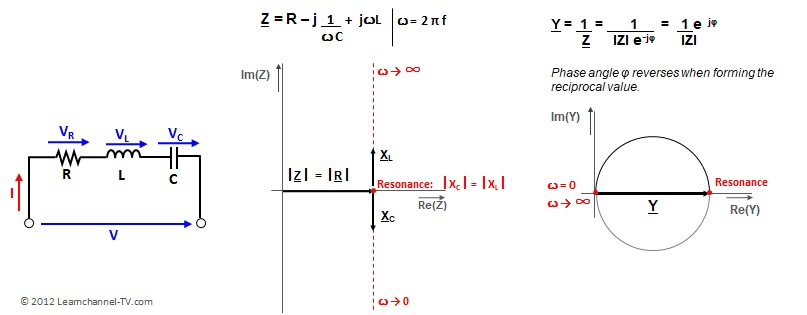
Locus Diagram - RLC in series, Resonance
Locus Diagram of Parallel RL Circuit
To understand the Locus Diagram of a parallel circuit, it is probably easiest to first have a look at the Locus Diagram of the admittance and then use that to determine the locus of the impedance:
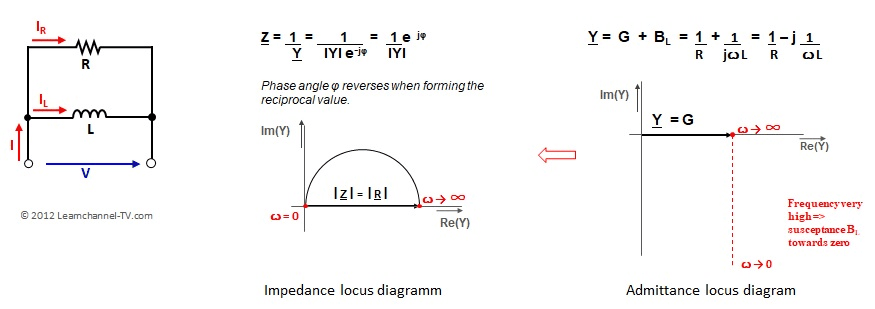
Locus Diagram RL parallel circuit
Locus Diagram of Parallel RC Circuit
Again, the easiest way is to first look at the locus of the admittance and then use it to determine the locus of the impedance. The angle of the pointers for admittance and impedance results from the phase shift between current and voltage at the capacitor (current IC leads by 90°).
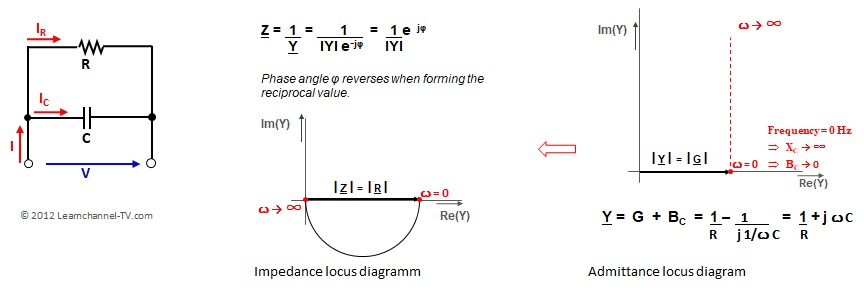
Locus diagram of RC in parallel
Locus Diagram of Parallel RCL Circuit
When connecting RLC in parallel, it should be noted that the impedance is highest at resonance case, i.e. XC = XL:
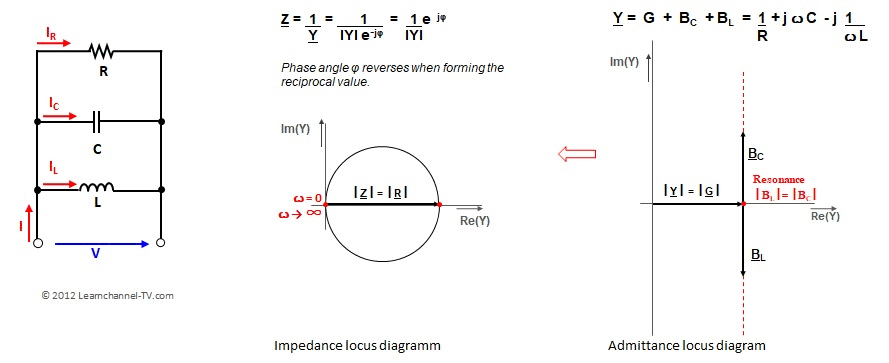
Locus diagram of RLC in parallel
Exercise part for Locus Diagrams
Exercise – Locus diagram in electrical engineering
